DATA ANALYST & VISUALIZATION SPECIALIST

TRANSFORMING DATA INTO INSIGHTS

Passionate about uncovering stories hidden in data through powerful visualizations and analytical solutions. Specializing in Power BI, Python, SQL, and modern web technologies.

01

ABOUT ME

Hello! I'm Harsh Soni, a passionate Data Analytics fresher with a strong interest in transforming raw data into meaningful insights. I enjoy working with data to identify patterns, trends, and actionable information that support better decision-making.

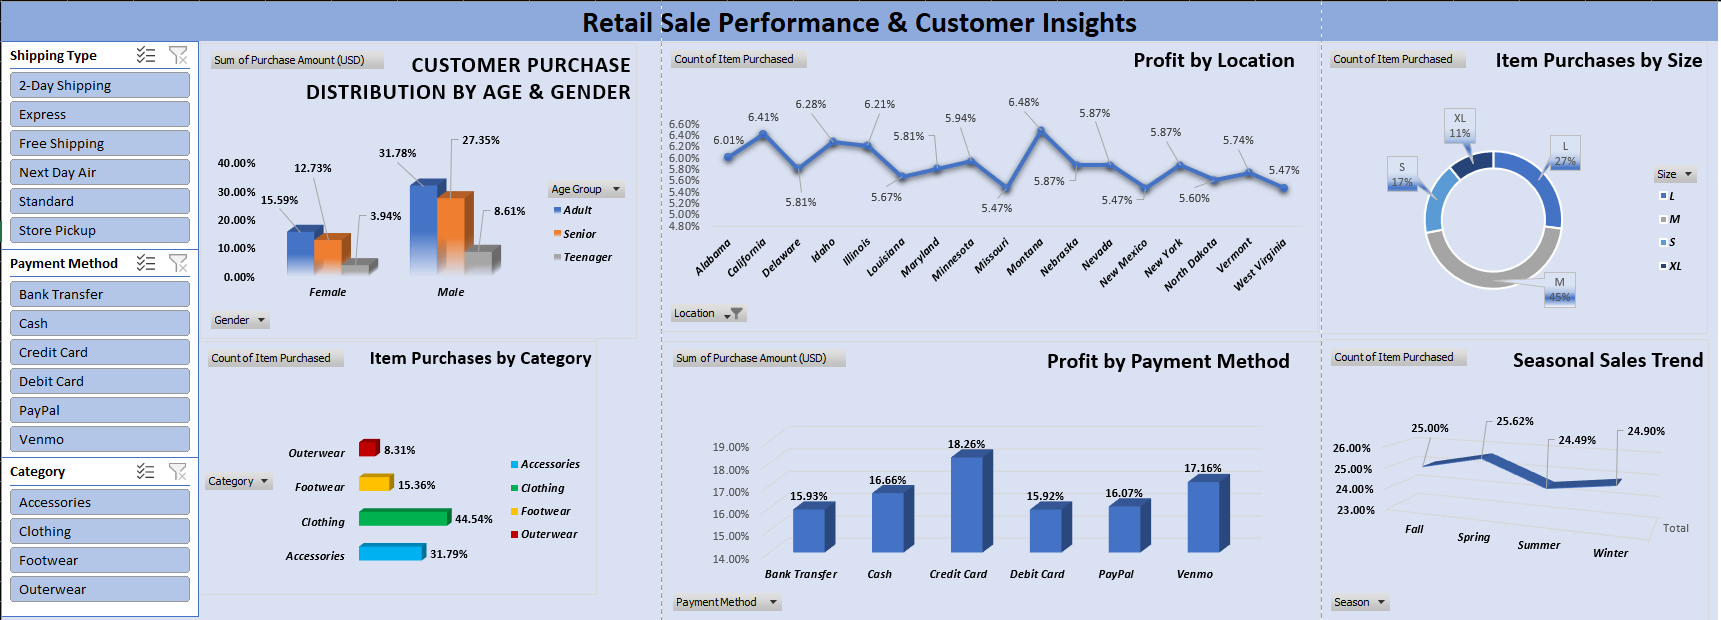
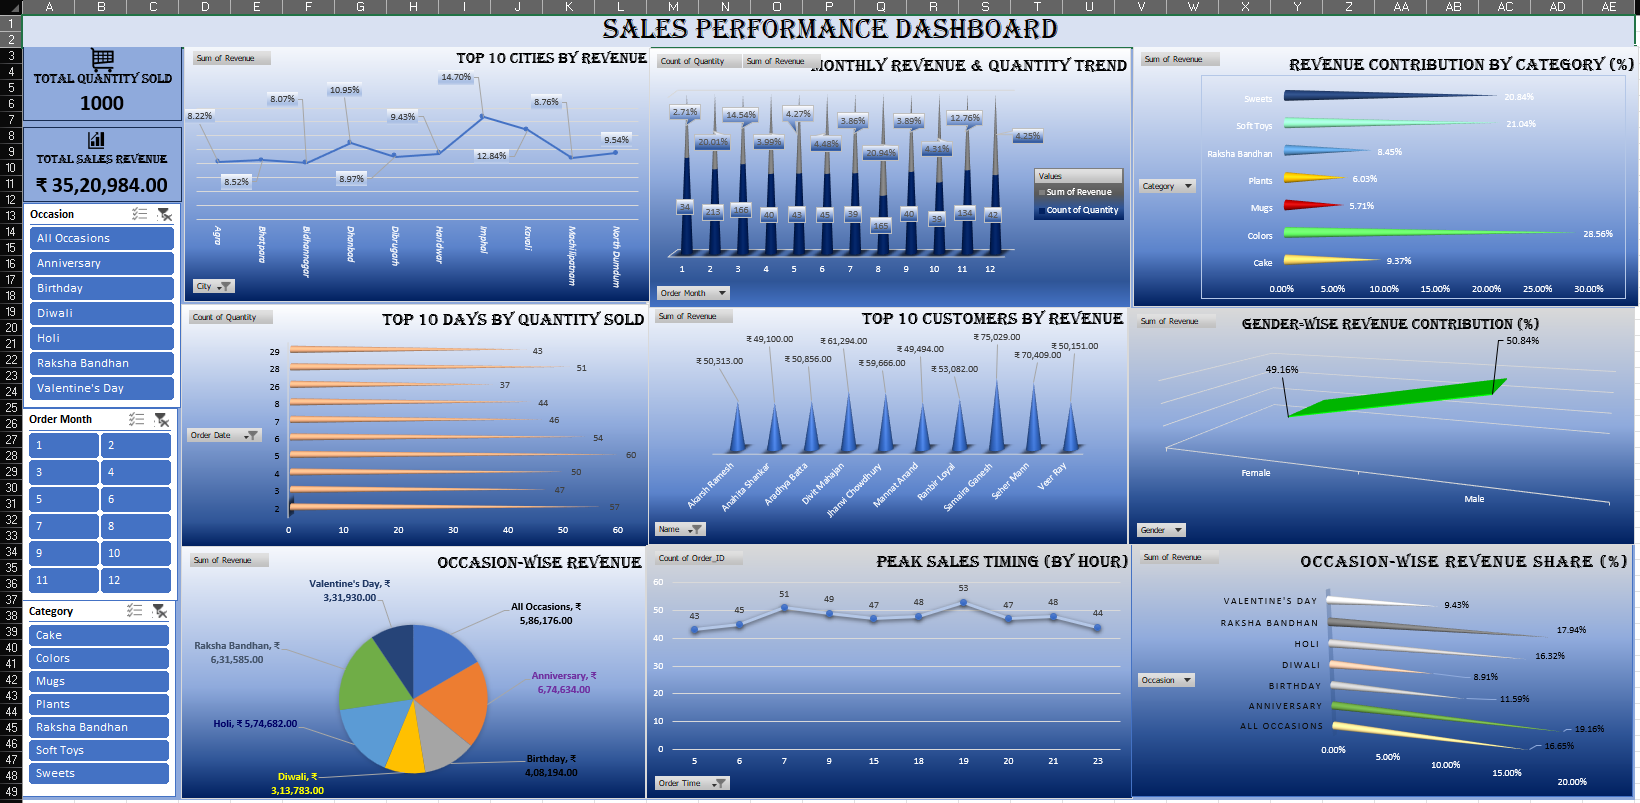
I have hands-on experience in data analysis, data cleaning, and building interactive dashboards using tools like Excel, SQL, Power BI, and Python.

Hackathon Experience

Participated in the NASA Space Apps Challenge – Jabalpur Edition.

Developed “Solar For All”, a data-driven web solution.

🏆 Achievement: Shortlisted among the Top 50 teams at the Jabalpur regional level.

0 Projects Completed
0 Skills Mastered
0 % Dedication
02

TECHNICAL SKILLS

Power BI

Power BI

Advanced dashboard creation, DAX formulas, data modeling

Python

Python

Pandas, NumPy, Matplotlib, Data cleaning & analysis

MySQL

SQL / MySQL

Complex queries, database design, optimization

Excel

Excel

Advanced formulas, pivot tables, macros, VBA

HTML

HTML5

Semantic markup, accessibility, modern standards

CSS

CSS3

Responsive design, animations, flexbox, grid

JavaScript

JavaScript

ES6+, DOM manipulation, async programming

C++

C++

Object-oriented programming, algorithms, data structures

03

FEATURED PROJECTS

Excel Pivot Charts

Retail Analytics Dashboard

Analyzed customer purchase behavior and profit by location using Advanced Excel. Visualized key trends in category performance and seasonal sales.

Excel Business Intelligence

Sales Performance Dashboard

Comprehensive sales tracking system built in Excel. Monitors KPI performance, revenue growth, and regional sales distribution.

NASA Hackathon Web Dev

Solar For All (Top 50)

NASA Space Apps Challenge (Jabalpur) – Top 50 Team. Interactive web platform promoting solar energy adoption with a custom calculator.

Python Pandas

Data Cleaning & Visualization

Real-world data cleaning pipeline using Python. Handled missing values, outliers, and visualized trends using Matplotlib & Seaborn.

04

INTERACTIVE DASHBOARDS

National Aadhaar Enrollment Analysis

UIDAI Data Hackathon Project: Analyzed enrollment trends, operational pressure, and demographics. Identified that the 0-5 age group drives majority enrollment and revealed strong weekday institutional dominance.

Enterprise Sales Intelligence

Operational business intelligence dashboard focused on enterprise-level metrics, growth tracking, and performance analysis using Star Schema modeling.

Amazon Sales Dashboard

Comprehensive analysis of Amazon sales data with metrics on revenue, customer demographics, product categories, and regional performance.

Healthcare Analytics Suite

In-depth healthcare data visualization featuring patient statistics, treatment efficacy, resource allocation, and operational insights.

05

GET IN TOUCH

Let's Work Together

I'm always interested in hearing about new projects and opportunities. Whether you have a question or just want to say hi, feel free to reach out!

Location Jabalpur, Madhya Pradesh, India